The fastest way to find the cause of a bug is essentially learning how to properly use the debugging tools provided in your development environment, and perhaps - common sense! In a large code base of over a thousand lines of code, understanding how data is passed, manipulated and used are distinctively important to know. The worst thing a software developer can do is to make assumptions. It can lead to errors and unexpected outcomes.
On Android studio, when you create a project, it comes default as allowing you to debug. Usually in an enterprise codebase, you can have various build variants – production, qa (develop), release etc. Each of the build variants can have different meanings to your team. Production builds are generally not debuggable for security reasons and should be disabled before publishing in Google play store. Hence, with a variety of build flavors, you can choose which build to make debuggable.

Debugging on Android studio allows you to set breakpoints on specific lines of code that allows the developer evaluate what data an object, function, expression or variable holds during runtime. With debugging, errors in code implementation and false assumptions about how the applications should be working can be clarified.
There are two ways to start debugging your application: (a.) running the application in debug mode, or (b.) attaching the debugger.
To start running the application in debug mode, you click on the debugger icon  which launches a new instance of the application. However, if the application is already running, you can attach the debugger at any time of the execution of the application by clicking.
Some differences between the two ways of debugging is that the former restarts the application in a debug mode, while the latter starts the debugger from whatever the stage the application is during runtime. Also, attaching the debugger while the application is running is faster and can be used to go straight to the class where the data needs to be examined.
As soon as the debugger is attached, the debug tab usually at the bottom of the Android Studio reveals that the debugger has been attached. (Android Studio allows you to place this tab at top, bottom, left or right of the IDE. I usually leave it at bottom left of the IDE)

On the left side of the bottom pane are controls used to manage the debugger.

They allow you to resume, pause or stop debugging, or to view or mute breakpoints. You find the usefulness of them as you debug often.
Breakpoints can be set on code lines which would reveal the data being examined. Setting breaking points is enabled by clicking on the left side of the line of code and a red dot appears near the line.

When running the debugger, the application execution stops at these breakpoints and using the debugger controls you can “resume” the application process, pause or stop the entire debugging. Hovering over your line of code when the application stops at a breakpoint reveals the data the code contains.

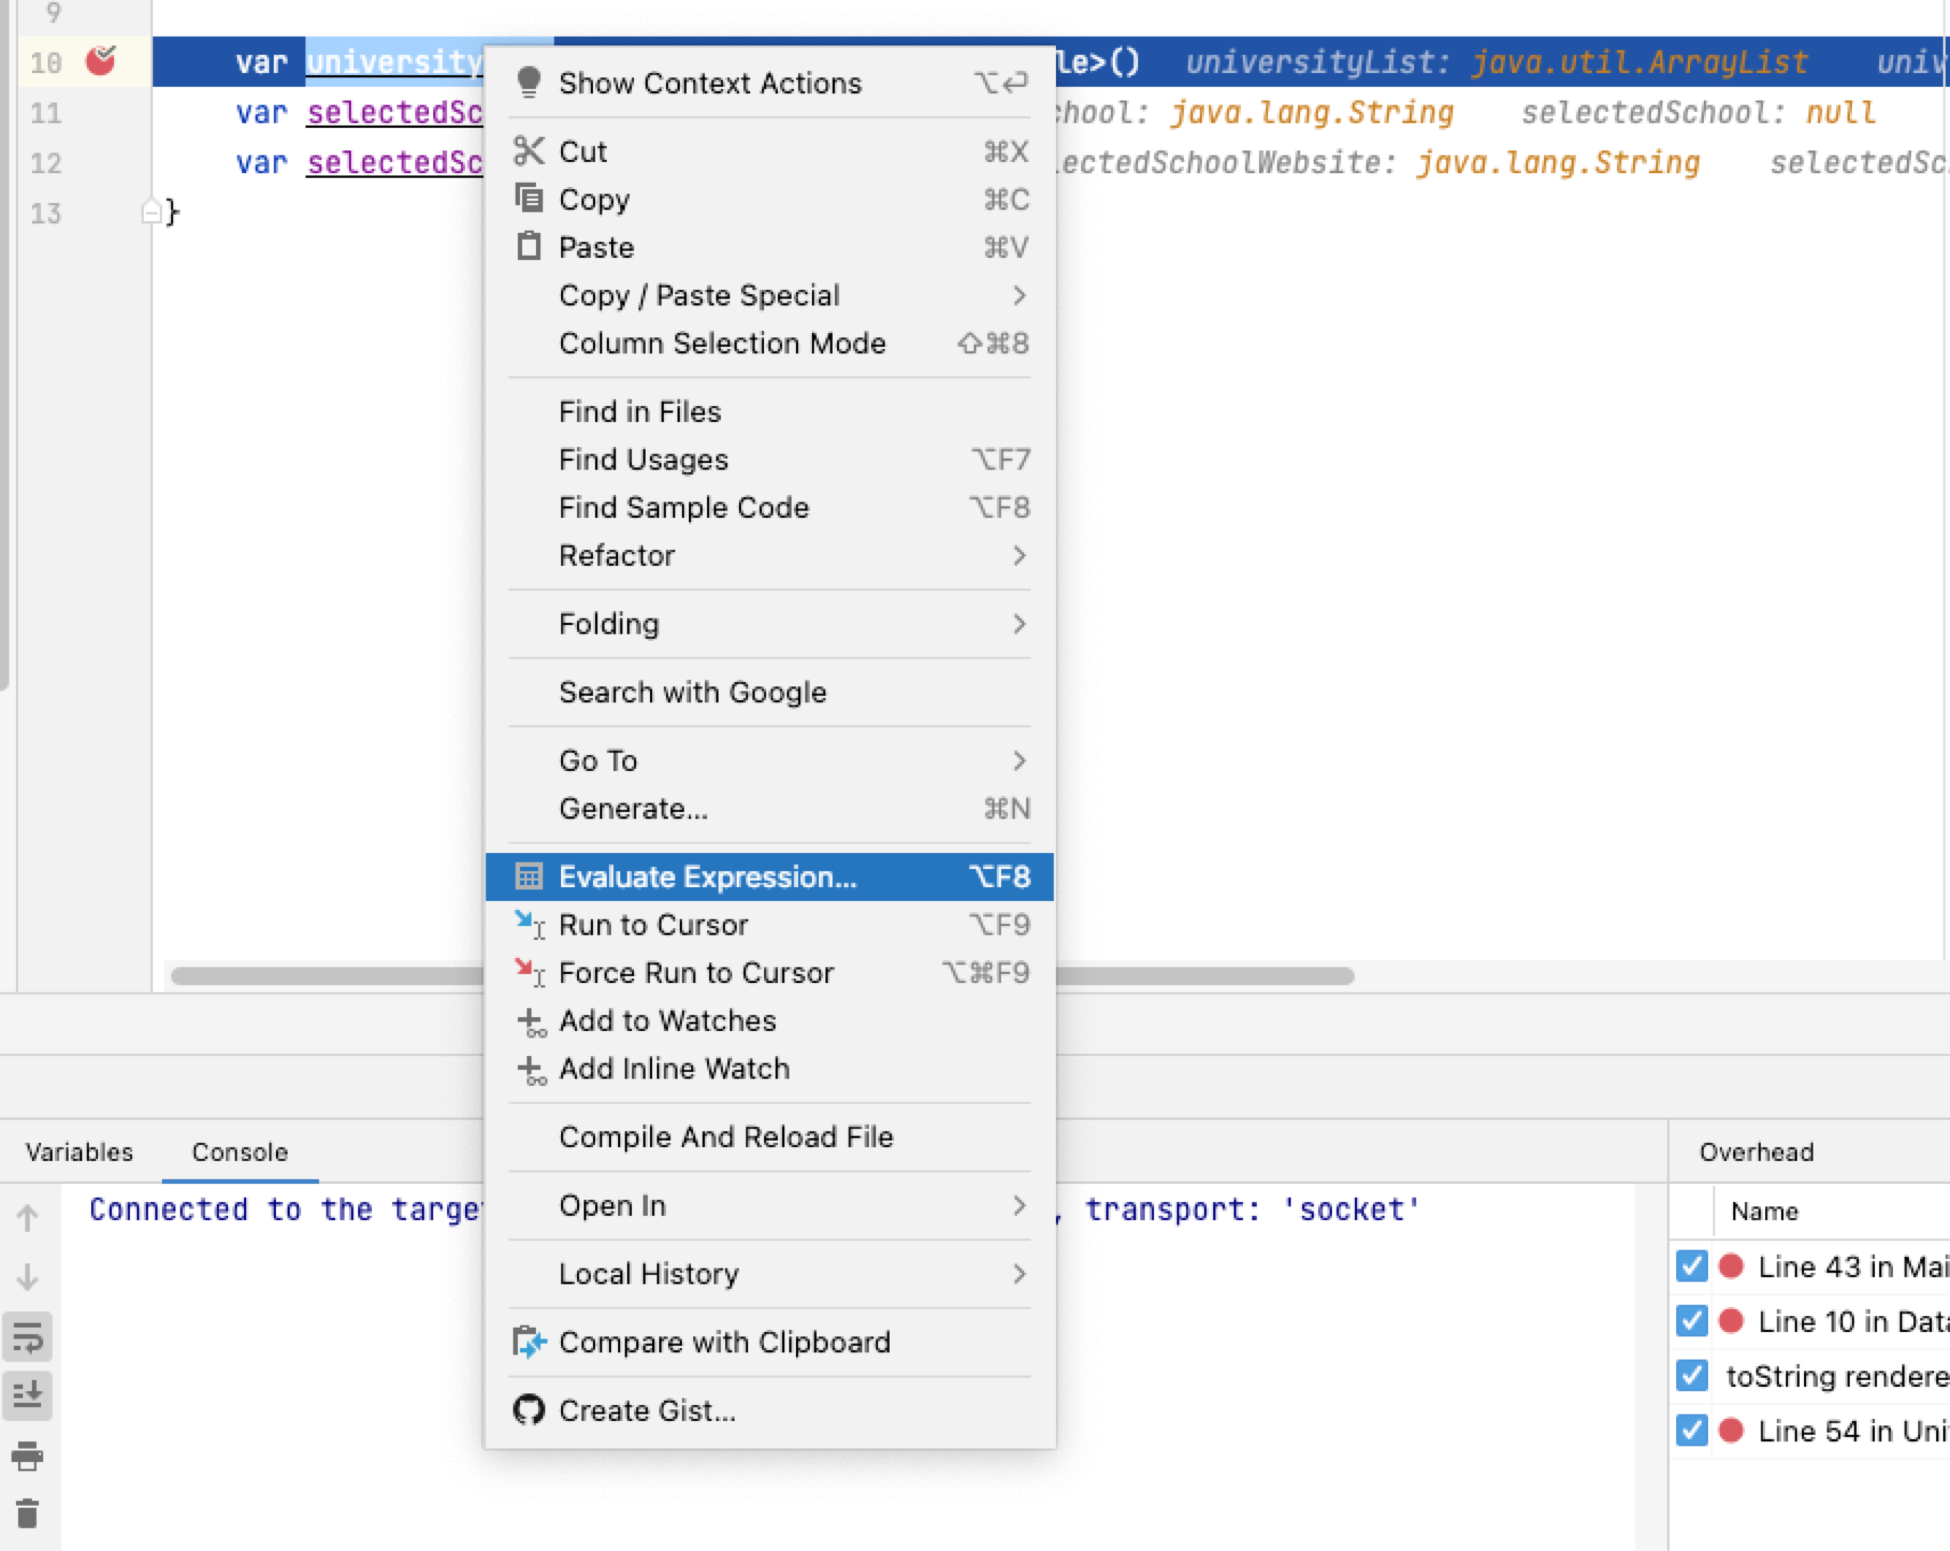
You can also choose to evaluate an expression to get further details about your object or variable. At the bottom pane of Android studio is the “evaluate expression” tab 

You can also do this by right clicking on the breakpoint line and selecting it.

This allows you to add additional code and test the veracity of your data at that point of the breakpoint.
During debugging you may have reasons to want to get more information about your data, hence Android Studio has some additional controls on how you debug.

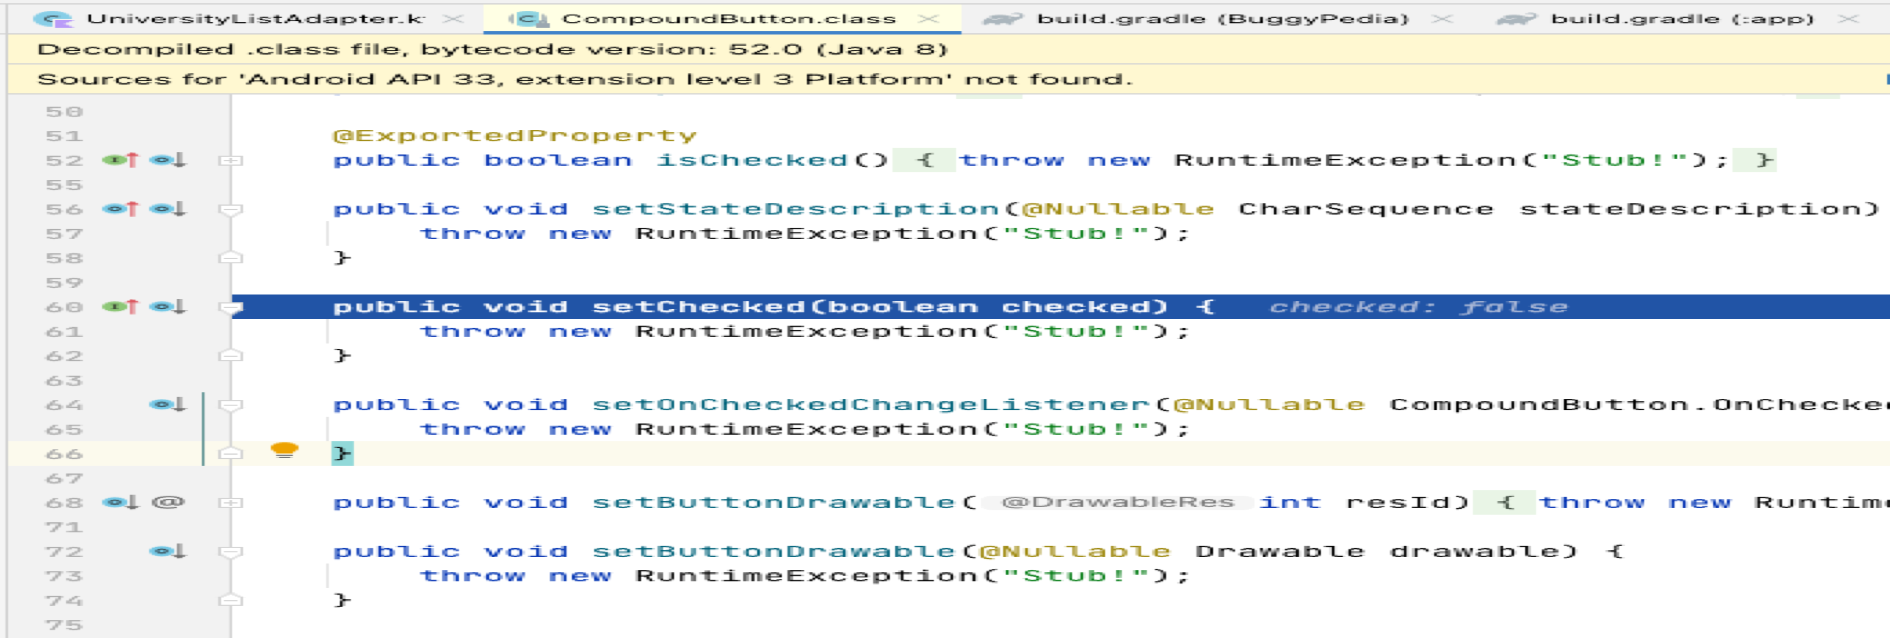
Sometimes when debugging the debugger can go on a penchant to inner SDK classes that you do not need to be debugging. Such as decompiled class files. That is not necessary.

Hence these controls may come in useful to bring back the debugger to the lines of code you need evaluated. The “Step Out” (F8) control finishes the execution of the method where it is at and then returns to the line of code where that method was being called.
For example:
(Line 32) holder.checkbox.text = itemPosition.name
The above line sets the textview value and this is possible because in the TextView class it has a setText function that sets the text to be displayed. Hence when the breakpoint is placed on line 32 and the debugger lands on this line, when “Step In” (F7) is clicked it takes youy to the TextView decompiled file and on the function that has the setText function.
public final void setText(CharSequence text) {
throw new RuntimeException(“Stub!”);
}
You do not need to debug this. To get out, click the “Step Out” (F8) control which takes you back to the above line 32, where that function is being called. Remaining on target and ensuring that you are debugging what is relevant to fixing the bug is important when debugging.
Other controls include “Force Step Into”, “Drop Frame” and “Run Cursor” which can be useful when debugging depending on the goal of the debugging.
Miscellaneous
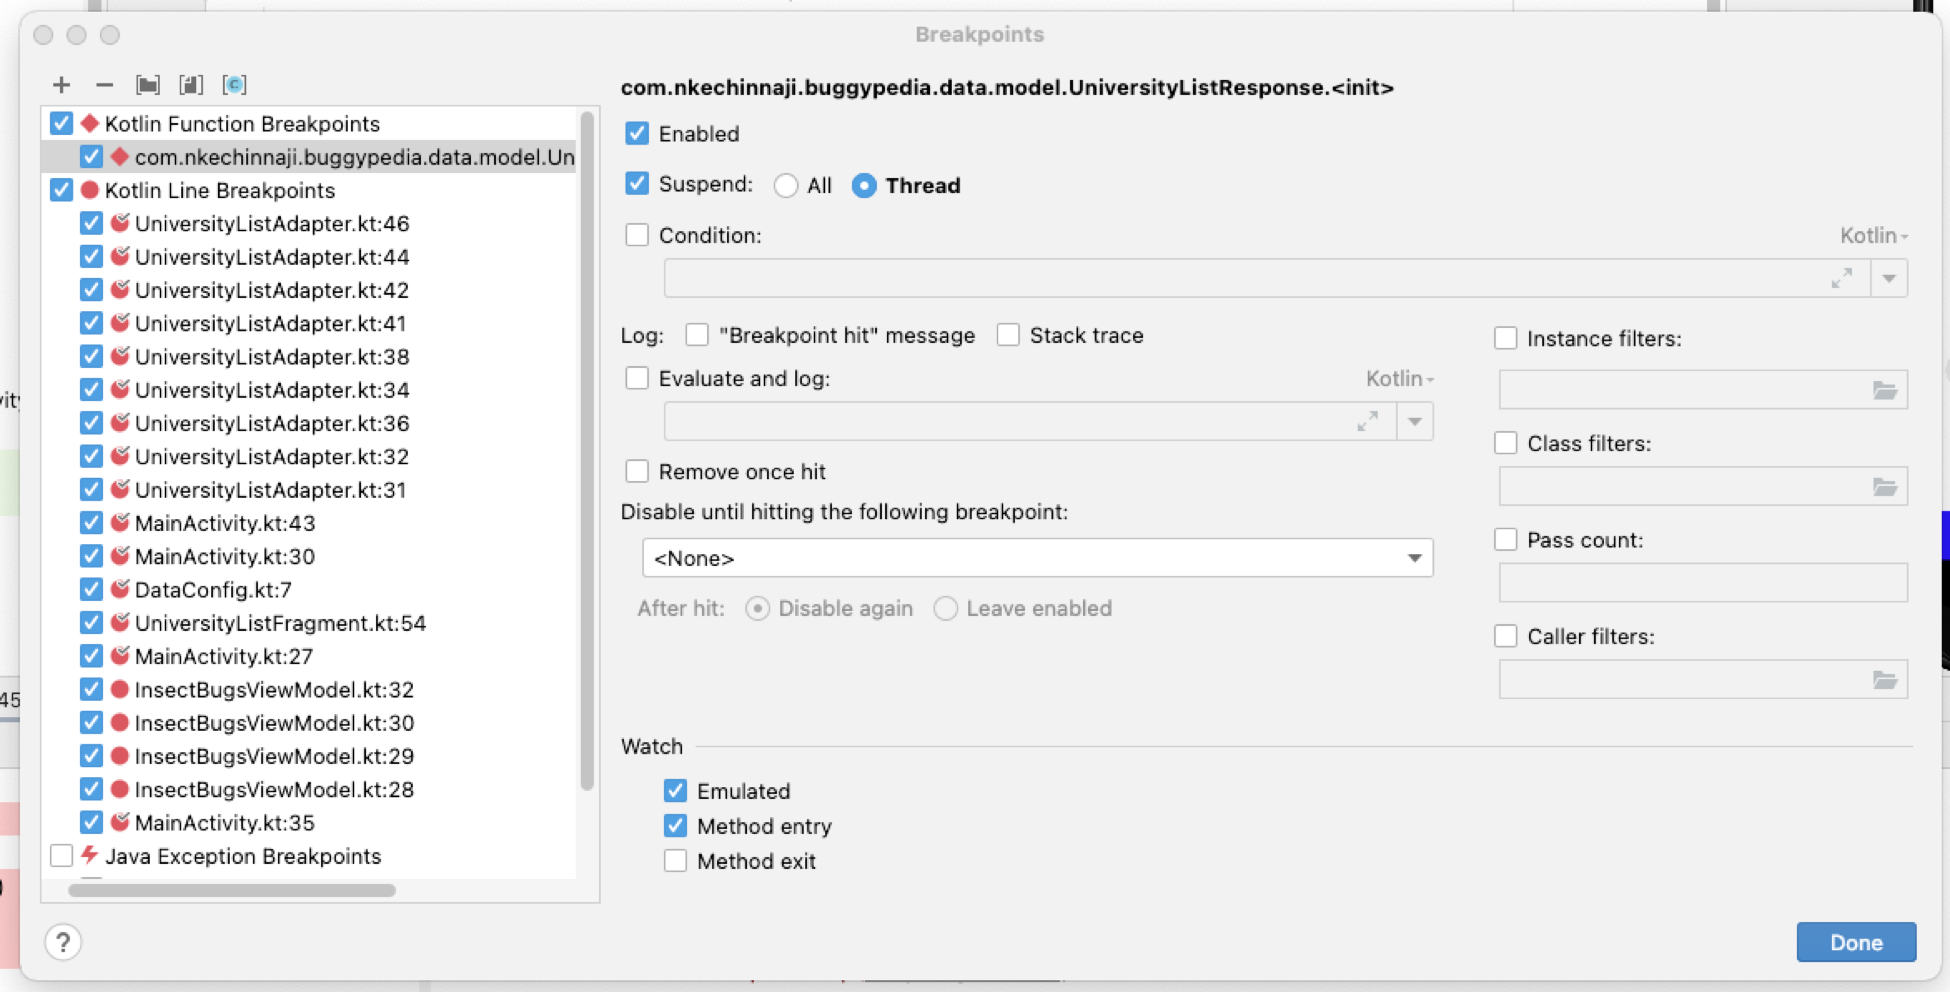
When you start using breakpoints, even when working on different branches of your code, those breakpoints still remain there unless you take them off. In a codebase with so many files and so many lines of code would be difficult to remove those breakpoints one-by-one. When debugging a running application will stop execution at each of those points. Android Studio provides a means which allows you remove all breakpoints easily.

In the above image, clearly there are too many breakpoints some of which are not relevant anymore. Unchecking the topmost checked box, removes all the breakpoints or you can choose to remove any one individually.
As you get more comfortable with debugging you learn a faster and efficient way to understand what’s going on in your codebase.
The code snippets used in this article can be found at: https://github.com/nbnnaji/DaintyDebugger
Happy coding!